About ThreadSpy
Code Confidence™ ThreadSpy™ is a thread-aware debugging technology for use in the debugging of software applications running on remote embedded hardware. It enables embedded system engineers to inspect the state of individual threads within their applications during development, simplifying and accelerating the debugging process. Implementations of ThreadSpy are available for the eCos® real-time operating system and the FreeRTOS kernel.
Rationale
Access to thread-specific state information brings substantial productivity benefits to developers when debugging multi-threaded applications. Presentation of the call stack of each thread and the value of thread-local data within in each stack frame is particularly valuable. But retrieval of this information requires knowledge of the thread-related data structures used by the underlying operating system. Thread-aware debugging is therefore typically implemented in the form of a debugging stub which executes on the embedded hardware and can retrieve thread states programatically.
The advent of low-cost microcontrollers featuring on-chip memory of limited capacity has led to the increased use of JTAG and BDM hardware for debugging. This eliminates the need for debugging stubs and their associated memory overheads. However, JTAG/BDM debuggers operate at the processor level and typically have no awareness of RTOS behaviour. Without such awareness, the intrinsic difficulties of debugging multi-threaded applications are compounded.
ThreadSpy technology allows developers to choose a JTAG- or BDM-based solution for their debugging activities without sacrificing the thread-aware capabilities more commonly associated with debug stubs. It offers the best features of both JTAG/BDM hardware and debugging stubs without the compromises.
Operation
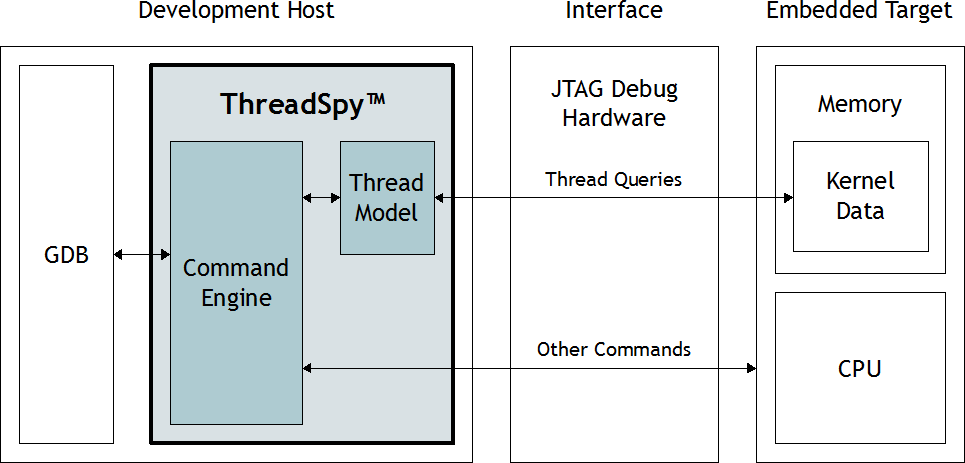
ThreadSpy operates in conjunction with GDB, the GNU debugger, ensuring widespread compatibility with JTAG hardware, BDM hardware and other on-chip debug interfaces which support the GDB remote protocol. It intercepts thread-related queries raised by GDB and provides responses to these queries from its own configurable model of kernel thread states. The thread model is updated on a just-in-time basis using optimized memory read sequences. Communication with the embedded hardware is minimised to ensure that the debugger remains responsive while single-stepping through code.

Advantages
ThreadSpy advantages include:
- Immediate access to thread call stacks and thread-local data
- Support for the GDB implementation of thread-specific breakpoints
- Substantial developer productivity improvements
- Compatibility with a wide range of JTAG debuggers, BDM debuggers and other on-chip debug interfaces supporting the GDB remote protocol
- Re-use of existing debug hardware where appropriate
- Configurable for multiple processor architectures
Integration
ThreadSpy technology is fully integrated within the Code Confidence Tools for eCos and the Code Confidence Tools for FreeRTOS via dedicated CDT remote debugging launchers. Changes to the configuration of the RTOS kernel are accommodated automatically.
ThreadSpy can be ported to other embedded operating systems. Please contact us to discuss your requirements.


