Code Confidence technical note 0004 - Non-invasive profiling of eCos applications on Cortex-M hardware
This technical note describes procedure for the profiling of eCos applications using the non-invasive PC sampling capability provided by many ARM® Cortex™-M processors. STM32 target hardware is used with the Ronetix PEEDI debugger in this illustration, but the procedure may be adapted for other embedded targets and other serial wire debug (SWD) adapters which provide a profiling capability.
Statistical profiling is a valuable technique for determining which parts of a program would most benefit from performance optimisation. The technique involves sampling the value of the processor's Program Counter (PC) register at regular intervals to build up a histogram of the time spent in executing various parts of the program. The eCos RTOS includes a profiling package (CYGPKG_PROFILE_GPROF) which allows for such a histogram to be generated on an embedded target using a hardware timer to trigger PC sampling code at high frequency. This technique works well in cases where sufficient target memory is available to hold the histogram data and where the application itself is not sensitive to the additional processing requirements of the PC sampling code. However, many Cortex-M processors incorporate debug features which allow for the non-invasive sampling of the program counter. By using the PC sampling capability of the Data Watchpoint and Trace (DWT) unit, application execution is unaffected and the statistical profiling of applications with stringent memory usage or timing requirements is possible.
The generation of statistical profiling data using this technique involves configuration of both the processor's debug features and the SWD adapter itself. The processor is configured by writing to a number of memory-mapped debug registers using a configuration script appropriate for the debug adapter. In this example, an STM32 processor is configured by appending memory write commands to an initialisation section of a PEEDI configuration script as follows:
The applicable initialisation section is defined by the CORE0_INIT parameter in the [PLATFORM_CortexM3_SWD] section of the script. Note that, in the case of STM32 processors, the debug MCU configuration register at 0xE0042004 must be configured to assign trace pins for asynchronous use. Configuration of the other registers indicated above is common to all Cortex-M variants. The final write to the DWT control register at 0xE0001000 is used to enable PC sampling at a frequency dictated by the CPU clock, the CYCTAP bit and the POSTPRESET value. In this example, the processor is running at 72MHz and this clock frequency is divided by 1024 to drive a post scalar counter. Since POSTPRESET is set to 0xF, PC sampling will occur on every 16th transition of the post scalar counter. The PC sampling frequency is therefore 4395Hz. The sampling frequency may be increased by adjusting the CYCTAP bit and the POSTPRESET value, but the use of a significantly higher frequency will result in rapid saturation of the 16-bit sample counters and consequent distortion of the profile histogram.
The PEEDI debug adapter may be configured to generate a profile histogram by adding the following command to the [PLATFORM_CortexM3_SWD] section of the configuration script:
The three parameters in the above command indicate the start address of the executable code on the target, the length of the executable code, and the virtual location of the profiling buffer. Any PC samples received by the debug adapter which lie outside the range specified in this command will be ignored. The time taken to retrieve the profiling buffer from the debugger may be minimised by specifying the start address and length of executable code accurately with reference to the _stext and _etext symbols defined by the linker. However, Cortex-M targets do not usually feature high capacity memories and the entire memory region containing the executable code (RAM or Flash) may therefore be specified to avoid the need for frequent reconfiguration of the debug adapter. The PEEDI debugger presents the profiling buffer to the developer as part of the memory map of the target hardware. The virtual address of the profiling buffer should therefore be chosen to avoid conflict with system memory and any memory-mapped devices.
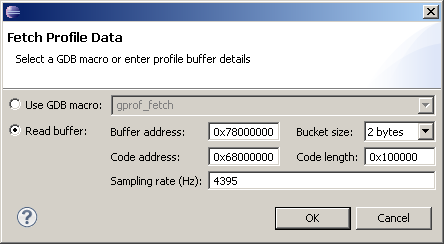
Having configured the debugger for profiling, an eCos application may be launched and executed using the high-performance eCos Remote Application DSF launcher provided with the Code Confidence Tools. Profiling data is accumulated silently within the PEEDI profiling buffer during execution. Profiling data may then be retrieved from the debug adapter for analysis on the development host by suspending execution and invoking the Fetch Profile Data dialog from the context menu in the Eclipse Debug view. In this example, the appropriate profiling buffer parameters are specified in the dialog as follows:

The profiling data is then uploaded, creating a data file named gmon.out in the relevant Eclipse project directory. This data may be analysed and presented using the GProf Integration feature (from the Eclipse Linux Tools project). Back…


