| build 3.0.0.201402161939 |
| build 3.0.0.201402161939 |
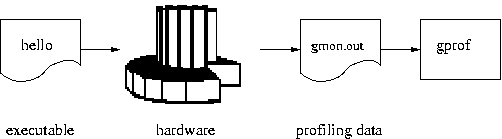
The GNU gprof tool provides profiling support. After a test run it can be used to find where the application spent most of its time, and that information can then be used to guide optimization effort. Typical gprof output will look something like this:
Each sample counts as 0.003003 seconds.
  %   cumulative   self              self     total
 time   seconds   seconds    calls  us/call  us/call  name
 14.15      1.45     1.45   120000    12.05    12.05  Proc_7
 11.55      2.63     1.18   120000     9.84     9.84  Func_1
  8.04      3.45     0.82                             main
  7.60      4.22     0.78    40000    19.41    86.75  Proc_1
  6.89      4.93     0.70    40000    17.60    28.99  Proc_6
  6.77      5.62     0.69    40000    17.31    27.14  Func_2
  6.62      6.30     0.68    40000    16.92    16.92  Proc_8
  5.94      6.90     0.61                             strcmp
  5.58      7.47     0.57    40000    14.26    26.31  Proc_3
  5.01      7.99     0.51    40000    12.79    12.79  Proc_4
  4.46      8.44     0.46    40000    11.39    11.39  Func_3
  3.68      8.82     0.38    40000     9.40     9.40  Proc_5
  3.32      9.16     0.34    40000     8.48     8.48  Proc_2
…
|
This output is known as the flat profile. The data is obtained by having a hardware timer generate regular interrupts. The interrupt handler stores the program counter of the interrupted code. gprof performs a statistical analysis of the resulting data and works out where the time was spent.
gprof can also provide information about the call graph, for example:
index % time    self  children    called     name
…
                0.78    2.69   40000/40000       main [1]
[2]     34.0    0.78    2.69   40000         Proc_1 [2]
                0.70    0.46   40000/40000       Proc_6 [5]
                0.57    0.48   40000/40000       Proc_3 [7]
                0.48    0.00   40000/120000      Proc_7 [3]
|
This shows that function Proc_1 was called only
from main, and Proc_1 in
turn called three other functions. Callgraph information is obtained
only if the application code is compiled with the -pg
option. This causes the compiler to insert extra code into each
compiled function, specifically a call to mcount,
and the implementation of mcount stores away the
data for subsequent processing by gprof.
| Caution |
There are a number of reasons why the output will not be 100% accurate. Collecting the flat profile typically involves timer interrupts so any code that runs with interrupts disabled will not appear. The current host-side gprof implementation maps program counter values onto symbols using a bin mechanism. When a bin spans the end of one function and the start of the next gprof may report the wrong function. This is especially likely on architectures with single-byte instructions such as an x86. When examining gprof output it may prove useful to look at a linker map or program disassembly. |
The eCos profiling package requires some additional support from the HAL packages, and this may not be available on all platforms:
There must be an implementation of the profiling timer. Typically this
is provided by the variant or platform HAL using one of the hardware
timers. If there is no implementation then the configuration tools
will report an unresolved conflict related to
CYGINT_PROFILE_HAL_TIMER and profiling is not
possible. Some implementations overload the system clock, which means
that profiling is only possible in configurations containing the eCos
kernel and CYGVAR_KERNEL_COUNTERS_CLOCK.
There should be a hardware-specific implementation of
mcount, which in turn will call the generic
functionality provided by this package. It is still possible to do
some profiling without mcount but the resulting
data will be less useful. To check whether or not
mcount is available, look at the current value of
the CDL interface CYGINT_PROFILE_HAL_MCOUNT in the
graphical configuration tool or in an ecos.ecc
save file.
This document only describes the eCos profiling support. Full details
of gprof functionality and output formats can be found in the gprof
documentation. However it should be noted that that documentation
describes some functionality which cannot be implemented using current
versions of the gcc compiler: the section on annotated source listings
is not relevant, and neither are associated command line options like
-A and -y.
To perform application profiling the gprof package
CYGPKG_PROFILE_GPROF must first be added to the
eCos configuration. On the command line this can be achieved using:
$ ecosconfig add profile_gprof
$ ecosconfig tree
$ make
|
Alternatively the same steps can be performed using the graphical configuration tool.
If the HAL packages implement mcount for the
target platform then usually application code should be compiled with
-pg. Optionally eCos itself can also be compiled with
this option by modifying the configuration option
CYGBLD_GLOBAL_CFLAGS. Compiling with
-pg is optional but gives more complete profiling
data.
Note: The profiling package itself must not be compiled with
-pgbecause that could lead to infinite recursion when doingmcountprocessing. This is handled automatically by the package's CDL.
Profiling does not happen automatically. Instead it must be started
explicitly by the application, using a call to
profile_on. A typical example would be:
#include <pkgconf/system.h>
#ifdef CYGPKG_PROFILE_GPROF
# include <cyg/profile/profile.h>
#endif
…
int
main(int argc, char** argv)
{
    …
#ifdef CYGPKG_PROFILE_GPROF
    {
        extern char _stext[], _etext[];
        profile_on(_stext, _etext, 16, 3500);
    }
#endif
    …
}
|
The profile_on takes four arguments:
These specify the range of addresses that will be profiled. Usually
profiling should cover the entire application. On most targets the
linker script will export symbols _stext and
_etext corresponding to the beginning and end of
code, so these can be used as the addresses. It is possible to
perform profiling on a subset of the code if that code is
located contiguously in memory.
profile_on divides the range of addresses into a
number of buckets of this size. It then allocates a single array of
16-bit counters with one entry for each bucket. When the profiling
timer interrupts the interrupt handler will examine the program
counter of the interrupted code and, assuming it is within the range
of valid addresses, find the containing bucket and increment the
appropriate counter.
The size of the array counters is determined by the range of addresses being profiled and by the bucket size. For a bucket size of 16, one counter is needed for every 16 bytes of code. For an application with say 512K of code that means dynamically allocating a 64K array. If the target hardware is low on memory then this may be unacceptable, and the requirements can be reduced by increasing the bucket size. However this will affect the accuracy of the results and gprof is more likely to report the wrong function. It also increases the risk of a counter overflow.
For the sake of run-time efficiency the bucket size must be a power of 2, and it will be adjusted if necessary.
The final argument specifies the interval between profile timer interrupts, in units of microseconds. Increasing the interrupt frequency gives more accurate profiling results, but at the cost of higher run-time overheads and a greater risk of a counter overflow. The HAL package may modify this interval because of hardware restrictions, and the generated profile data will contain the actual interval that was used. Usually it is a good idea to use an interval that is not a simple fraction of the system clock, typically 10000 microseconds. Otherwise there is a risk that the profiling timer will disproportionally sample code that runs only in response to the system clock.
profile_on can be invoked multiple times, and
on subsequent invocations, it will delete profiling data
and allocate a fresh profiling range.
Profiling can be turned off using the function
profile_off:
void profile_off(void); |
If the eCos configuration includes a TCP/IP stack and if a tftp daemon
will be used to extract the data
from the target then the call to profile_on
should happen after the network is up. profile_on
will attempt to start a tftp daemon thread, and this will fail if
networking has not yet been enabled.
int
main(int argc, char** argv)
{
    …
    init_all_network_interfaces();
    …
#ifdef CYGPKG_PROFILE_GPROF
    {
        extern char _stext[], _etext[];
        profile_on(_stext, _etext, 16, 3000);
    }
#endif
    …
}
|
The application can then be linked and run as usual.
When gprof is used for native development rather than for embedded targets the profiling data will automatically be written out to a file gmon.out when the program exits. This is not possible on an embedded target because the code has no direct access to the host's file system. Instead the gmon.out file has to be extracted from the target as described below. gprof can then be invoked normally:
$ gprof dhrystone
Flat profile:

Each sample counts as 0.003003 seconds.
  %   cumulative   self              self     total
 time   seconds   seconds    calls  us/call  us/call  name
 14.15      1.45     1.45   120000    12.05    12.05  Proc_7
 11.55      2.63     1.18   120000     9.84     9.84  Func_1
  8.04      3.45     0.82                             main
…
|
If gmon.out does not contain call graph data,
either because mcount is not supported or because
this functionality was explicitly disabled, then the
-no-graph must be used.
$ gprof --no-graph dhrystone
Flat profile:

Each sample counts as 0.003003 seconds.
  %   cumulative   self              self     total
 time   seconds   seconds    calls  us/call  us/call  name
 14.15      1.45     1.45                             Proc_7
 11.55      2.63     1.18                             Func_1
  8.04      3.45     0.82                             main
…
|
By default gprof expects to find the profiling data in a file
gmon.out in the current directory. This package
provides two ways of extracting data: a gdb macro or tftp transfers.
Using tftp is faster but requires a TCP/IP stack on the target. It
also consumes some additional target-side resources, including an
extra tftp daemon thread and its stack. The gdb macro can be used even
when the eCos configuration does not include a TCP/IP stack. However
it is much slower, typically taking tens of seconds to retrieve all
the data for a non-trivial application.
The gdb macro is called gprof_dump, and can be found in the file gprof.gdb in the host subdirectory of this package. A typical way of using this macro is:
(gdb) source <repo>/services/profile/gprof/<version>/host/gprof.gdb
(gdb) gprof_dump
|
This macro can be used any time after the call to
profile_on. It will store the profiling data
accumulated so far to the file gmon.out in the
current directory, and then reset all counts. gprof uses only a 16 bit
counter for every bucket of code. These counters can easily saturate
if the profiling run goes on for a long time, or if the application
code spends nearly all its time in just a few tight inner loops. The
counters will not actually wrap around back to zero, instead they will
stick at 0xFFFF, but this will still affect the accuracy of the gprof
output. Hence it is desirable to reset the counters once the profiling
data has been extracted.
The file gprof.gdb contains two other macros which may prove useful. gprof_fetch extracts the profiling data and generates the file gmon.out, but does not reset the counters. gprof_reset only resets the counters, without extracting the data or overwriting gmon.out.
If the configuration includes a TCP/IP stack then the profiling data
can be extracted using tftp instead. There are two relevant
configuration options. CYGPKG_PROFILE_TFTP
controls whether or not tftp is supported. It is enabled by default if
the configuration includes a TCP/IP stack, but can be disabled to save
target-side resources.
CYGNUM_PROFILE_TFTP_PORT controls the UDP
port which will be used. This port cannot be shared with other tftp
daemons. If neither application code nor any other package (for
example the gcov test coverage package) provides a tftp service then
the default port can be used. Otherwise it will be necessary to assign
unique ports to each daemon.
If enabled the tftp daemon will be started automatically by
profile_on. This should only happen once the
network is up and running, typically after the call to
init_all_network_interfaces.
The data can then be retrieved using a standard tftp client. There are a number of such clients available with very different interfaces, but a typical session might look something like this:
$ tftp
tftp> connect 10.1.1.134
tftp> binary
tftp> get gmon.out
Received 64712 bytes in 0.9 seconds
tftp> quit
|
The address 10.1.1.134 should be replaced with the target's IP address. Extracting the profiling data by tftp will automatically reset the counters.
This package contains a number of configuration options. Two of these,
CYGPKG_PROFILE_TFTP and
CYGNUM_PROFILE_TFTP_PORT, related to support for
tftp transfers and have already
been described.
Support for collecting the call graph data via
mcount is optional and can be controlled via
CYGPKG_PROFILE_CALLGRAPH. This option will only be
active if the HAL provides the underlying mcount
support and implements CYGINT_PROFILE_HAL_MCOUNT.
The call graph data allows gprof to produce more useful output, but at
the cost of extra run-time and memory overheads. If this option is
disabled then the -pg compiler flag should not be used.
If CYGPKG_PROFILE_CALLGRAPH is enabled then there
are two further options which can be used to control memory
requirements. Collecting the data requires two blocks of memory, a
simple hash table and an array of arc records. The
mcount code uses the program counter address to
index into the hash table, giving the first element of a singly linked
list. The array of arc records contains the various linked lists for
each hash slot. The required number of arc records depends on the
number of function calls in the application. For example if a function
Proc_7 is called from three different places in
the application then three arc records will be needed.
CYGNUM_PROFILE_CALLGRAPH_HASH_SHIFT controls the
size of the hash table. The default value of 8 means that the program
counter is shifted right by eight places to give a hash table index.
Hence each hash table slot corresponds to 256 bytes of code, and for
an application with say 512K of code profile_on
will dynamically allocate an 8K hash table. Increasing the shift size
reduces the memory requirement, but means that each hash table slot
will correspond to more code and hence mcount
will need to traverse a longer linked list of arc records.
CYGNUM_PROFILE_CALLGRAPH_ARC_PERCENTAGE controls
how much memory profile_on will allocate for the
arc records. This uses a simple heuristic, a percentage of the overall
code size. By default the amount of arc record space allocated will be
5% of the code size, so for a 512K executable that requires
approximately 26K. This default should suffice for most applications.
In exceptional cases it may be insufficient and a diagnostic will be
generated when the profiling data is extracted.
The profiling package requires HAL support: A function
hal_enable_profile_timer and an implementation
of mcount. The profile timer is required.
Typically it will be implemented by the variant or platform HAL
using a spare hardware timer, and that HAL package will also
implement the CDL interface
CYGINT_PROFILE_HAL_TIMER. Support for
mcount is optional but very desirable. Typically
it will be implemented by the architectural HAL, which will also
implement the CDL interface
CYGINT_PROFILE_HAL_MCOUNT.
#include <pkgconf/system.h>
#ifdef CYGPKG_PROFILE_GPROF
# include <cyg/profile/profile.h>
#endif

int
hal_enable_profile_timer(int resolution)
{
    …
    return actual_resolution;
}
|
This function takes a single argument, a time interval in microseconds. It should arrange for a timer interrupt to go off after every interval. The timer VSR or ISR should then determine the program counter of the interrupted code and register this with the profiling package:
    …
    __profile_hit(interrupted_pc);
    …
|
The exact details of how this is achieved, especially obtaining the interrupted PC, are left to the HAL implementor. The HAL is allowed to modify the requested time interval because of hardware constraints, and should return the interval that is actually used.
mcount can be more difficult. The calls to
mcount are generated internally by the compiler
and the details depend on the target architecture. In fact
mcount may not use the standard calling
conventions at all. Typically implementing mcount
requires looking at the code that is actually generated, and possibly
at the sources of the appropriate compiler back end.
The HAL mcount function should call into the
profiling package using standard calling conventions:
    …
    __profile_mcount((CYG_ADDRWORD) caller_pc, (CYG_ADDRWORD) callee_pc);
    …
|
If mcount was invoked because
main called Proc_1 then the
caller pc should be an address inside main,
typically corresponding to the return location, and the callee pc
should be an address inside Proc_1, usually near
the start of the function.
For some targets the compiler does additional work, for example automatically allocating a per-function word of memory to eliminate the need for the hash table. This is too target-specific and hence cannot easily be used by the generic profiling package.