Code Confidence kernel-aware debug views
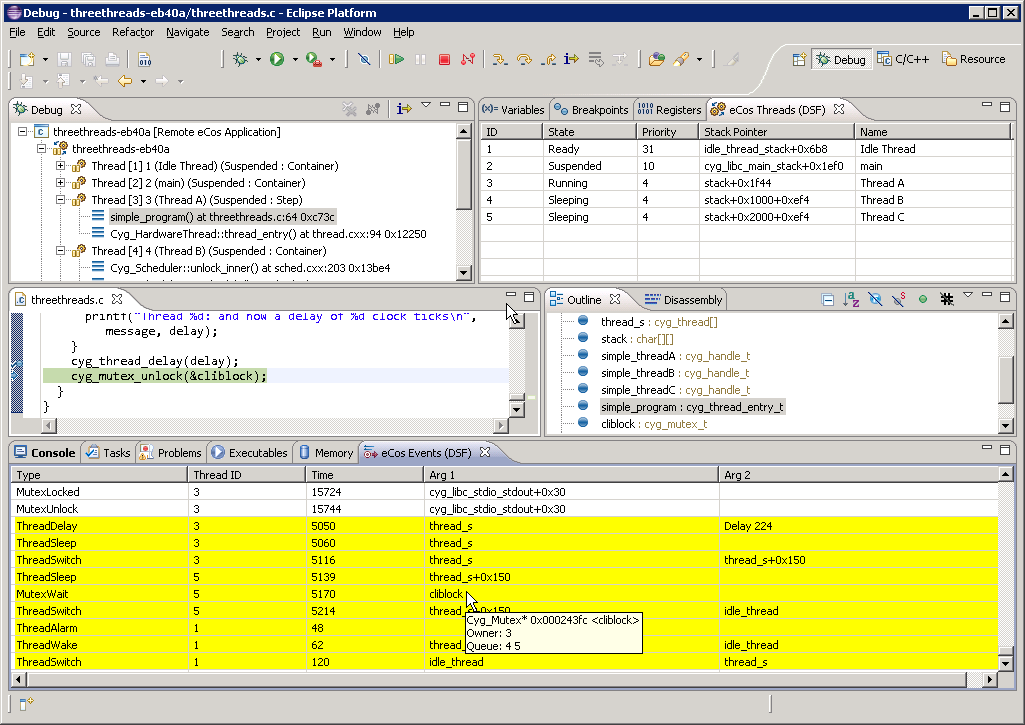
The following screenshot illustrates the presentation of eCos threads and eCos events in the context of debugging a multi-threaded eCos application:

The eCos Threads view indicates 5 threads of execution within the application. The thread named Thread A has state Running indicating that it was the currently running thread at the point execution was suspended. Other application-level threads have state Sleeping indicating that they are waiting for a specific kernel event. Thread priorities, stack pointers and kernel-assigned unique identifiers are also visible. The user may hover over stack pointer values to retrieve stack usage details from the target. The information presented in this view is obtained by interrogating the thread list maintained by the eCos kernel and is updated each time execution is suspended. An intelligent update mechanism ensures that the user interface remains responsive.
The eCos Events view presents a log of system-level events within the application. Event information is obtained using the instrumentation component of the eCos kernel. This facility allows the interaction of threads within a multi-threaded application to be captured while the application is running at almost full speed. New events are retrieved from the target and appended to the log each time execution is suspended. The recording of specific classes of event by the kernel may be enabled or disabled within the eCos Configuration Editor. Further flexibility is available by enabling and disabling specific events programatically within eCos application code. Developers may also raise user-defined events from application code which are then interleaved with system-level events within the eCos Events view.
In the above screenshot, eCos has been configured to record thread and mutex events. Three application-level threads are observed competing for ownership of a single mutex. The most recent events to be retrieved from the target are highlighted for clarity. Each event record includes an event type field, the unique ID of the executing thread, a high-resolution timestamp derived from the hardware clock and a pair of data fields which describe an associated thread or synchronisation object. The user may hover over the symbols representing these kernel objects to retrieve detailed current state information from the target. In this example, the tooltip for the mutex with symbolic name cliblock indicates that the mutex is locked by thread 3. An ordered list of threads that are waiting for ownership of the mutex is also presented.
For a further illustration of the power of the eCos Events view, please refer to technical note 0001. Back…


